Macs are known for smooth performance, but even the best machines slow down when too many apps compete for resources. System monitoring shows what's actually happening with your CPU, memory, storage, and network—so you can identify bottlenecks before they disrupt your workflow.
macOS Tahoe includes built-in monitoring tools that deliver real-time insights, and third-party apps add deeper visibility for users who want more control. Tracking performance metrics helps you work faster, troubleshoot issues, and keep your Mac running at its best.
Why System Monitoring Matters for Mac Users
Most people open Activity Monitor only when something goes wrong. That reactive approach means problems compound before you notice them. Active monitoring changes that dynamic by surfacing issues early—like a runaway background process consuming 80% CPU or an app slowly filling your storage.
Performance monitoring reveals patterns. You might discover that a browser extension consistently spikes memory usage, or that Time Machine backups saturate your network during work hours. With this information, you can schedule intensive tasks for off-peak times or disable resource-heavy features when precision matters.
Monitoring also protects your hardware. High CPU temperatures reduce processor lifespan, and constant disk activity wears SSDs faster. Real-time temperature and disk health data help you adjust workflows before thermal throttling kicks in or drive failures occur.
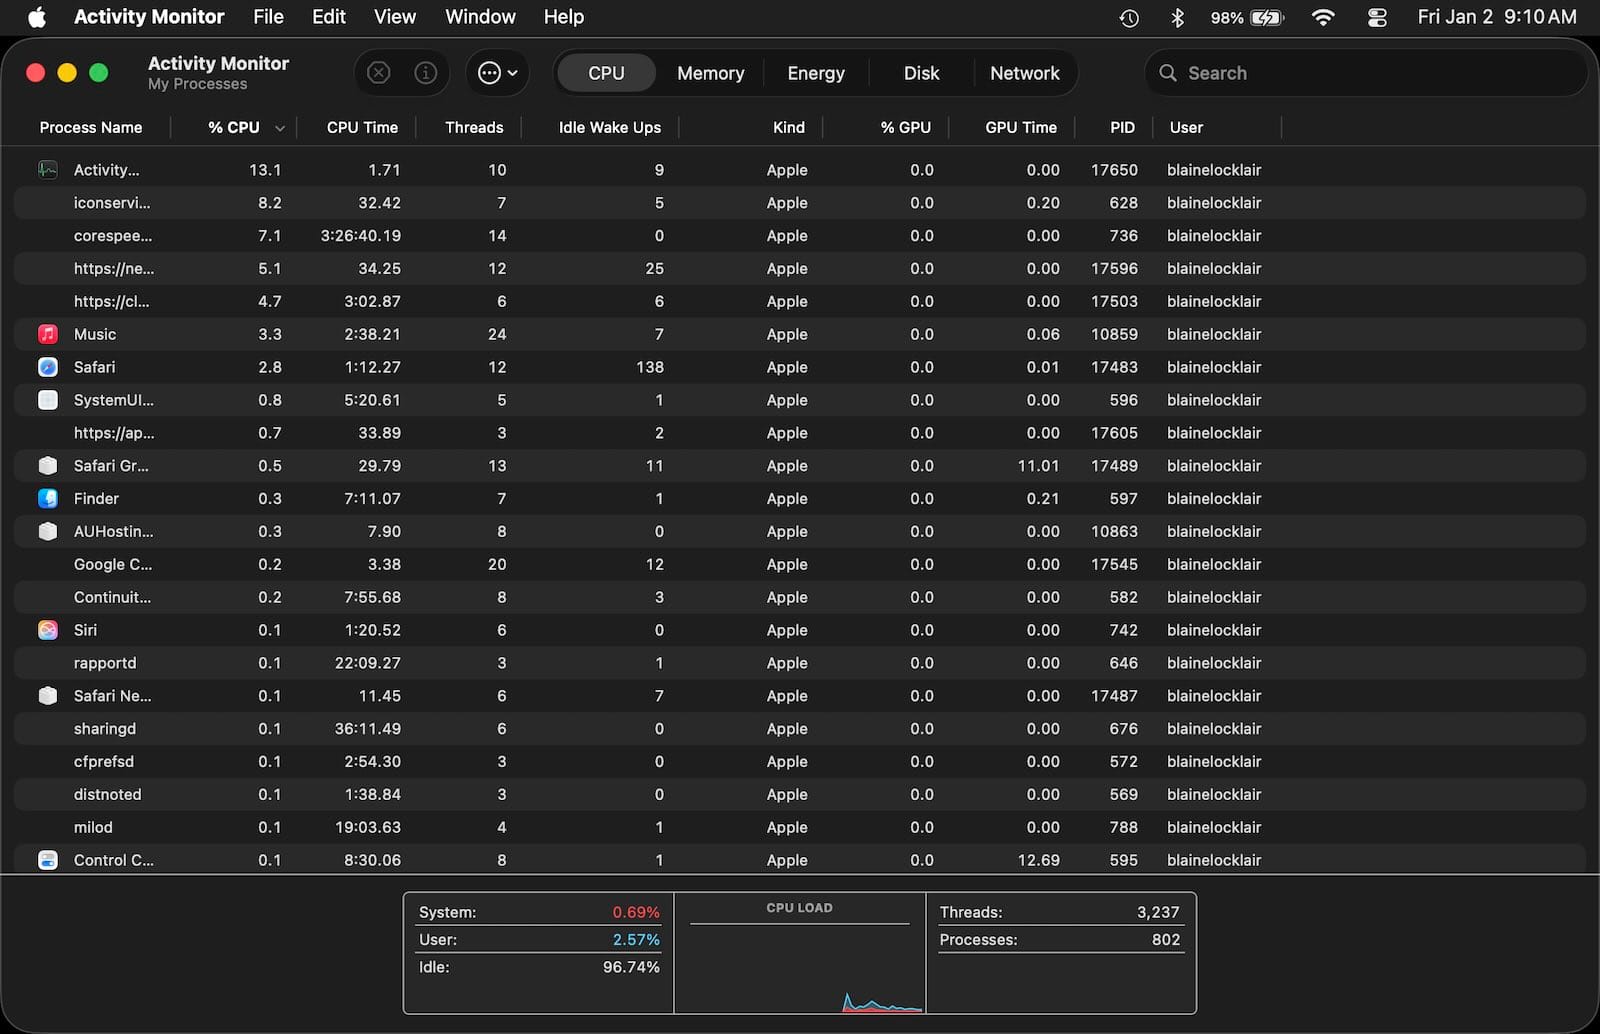
Activity Monitor: Your First Line of Defense
Activity Monitor ships with every Mac, and it's surprisingly capable once you understand its layout. Open it from Applications > Utilities, and you'll find five tabs: CPU, Memory, Energy, Disk, and Network.
The CPU tab shows which apps consume processing power. Sort by CPU percentage to identify resource hogs. The "% CPU" column can exceed 100% on Macs with multiple cores—a single app using 200% means it's maxing out two cores. Watch for apps consistently above 80% that aren't actively processing tasks; they're often stuck in loops.
Memory pressure appears at the bottom of the Memory tab as a color-coded graph. Green means your Mac has plenty of free RAM. Yellow indicates memory compression is active—macOS is squeezing data to fit available space. Red signals swap file activity, where the system writes RAM contents to your SSD because physical memory is exhausted. Sustained red pressure slows everything down.
The Energy tab ranks apps by their power consumption. This matters for MacBook users who want maximum battery life. Apps with high "12 hr Power" values drain batteries even when you're not actively using them. Quit unnecessary background processes to extend runtime.


Affiliate disclosure: some links in this article are Amazon Associate links. If you buy through them, Next Level Mac may earn a small commission at no extra cost to you, and we only recommend products that genuinely bring value to your Mac setup.
Disk activity shows read and write operations. High sustained writes indicate an app frequently saving data—video editing software, for example. The Network tab breaks down data sent and received by app. Unexpected network activity from an app you're not using can signal unwanted background syncing or, in rare cases, malware.
Menu Bar Monitoring with iStat Menus
Activity Monitor provides detailed diagnostics, but checking it repeatedly disrupts focus. Menu bar monitors solve this by displaying key metrics at a glance. iStat Menus is the most comprehensive option, offering CPU temperature, memory usage, disk activity, network throughput, and more—all visible without opening an app.
Installation takes seconds. Download iStat Menus from Bjango's website, launch it, and grant the necessary permissions in System Settings. The app adds customizable menu bar icons that show live data. Click any icon to see expanded details with historical graphs.
CPU monitoring displays usage per core, processor temperature, and fan speeds. Memory shows used, wired, active, and inactive RAM. The disk module tracks read/write speeds and remaining storage. Network monitoring reveals current upload and download rates, plus cumulative data transferred.
The sensor module is particularly useful for MacBook users. It shows battery health, charge cycles, and estimated time remaining. For desktop Macs, it monitors internal temperatures across multiple zones—helpful for identifying cooling issues before they cause throttling.
iStat Menus costs $14.99, but the 14-day trial lets you test all features. The investment pays off if you regularly troubleshoot performance or want passive awareness of system state. Customization options let you choose which metrics appear and how they're displayed, so your menu bar stays uncluttered.
External Storage for Better Performance
Monitoring often reveals storage bottlenecks—especially on Macs with smaller internal SSDs. Moving large files and intensive workflows to external storage frees internal space and can improve performance. The SanDisk 2TB Extreme Portable SSD delivers read speeds up to 1050 MB/s, making it suitable for video editing, photo libraries, and Time Machine backups. Here's where to get the SanDisk 2TB Extreme Portable SSD https://www.amazon.com/dp/B08HN37XC1?tag=nextlevelmac-20
The SSD connects via USB-C and includes a short cable. Compatibility with macOS, Windows, and iPadOS makes it versatile for users who work across platforms. The ruggedized enclosure withstands drops and splashes, which matters for portable workflows.
Some Macs benefit from multiple external drives—one for active projects and another for archives. System monitoring helps you decide which files to move. Watch the Disk tab in Activity Monitor while working. Apps generating sustained write activity are good candidates for external storage, especially if they're filling your internal SSD.
Adding Ports Without Sacrificing Performance
MacBooks with limited ports create connectivity bottlenecks. Plugging in external drives, displays, and peripherals quickly exhausts available connections. USB-C hubs solve this, but not all hubs are equal. Cheap adapters can throttle data transfer speeds or fail to deliver sufficient power.
The Anker USB C Hub provides seven ports: three USB-A, two USB-C, HDMI, and SD card slots. It supports 4K displays at 60Hz and passes through up to 85W of power to your MacBook while connected. This is where you can buy the Anker USB C Hub https://www.amazon.com/dp/B07ZVKTP53?tag=nextlevelmac-20
Data transfer speeds max out at 5 Gbps for USB-A ports and 10 Gbps for USB-C. That's sufficient for external SSDs, though it won't saturate the fastest NVMe drives. The HDMI port handles one external display, which works for most desk setups.
Heat management is solid. The aluminum body dissipates warmth during extended use, though it can feel warm to the touch when multiple high-power devices connect simultaneously. Keep the hub in open air rather than buried under papers.
System monitoring becomes more relevant when using hubs. Activity Monitor's Network tab shows bandwidth distribution across connected devices. If multiple drives compete for throughput, consider connecting high-bandwidth devices directly to Thunderbolt ports while routing peripherals through the hub.
Interpreting Temperature and Fan Behavior
Temperature monitoring prevents thermal throttling, where your Mac reduces CPU speed to avoid overheating. Intel Macs and Apple Silicon models both throttle, though Silicon chips handle heat more efficiently. Menu bar monitors display CPU and GPU temperatures in real time.
Safe operating temperatures depend on the chip. Apple Silicon Macs typically run between 40°C and 80°C under normal use. Sustained temperatures above 90°C indicate inadequate cooling or excessive workload. Intel MacBooks can reach 95°C during intensive tasks without damage, but consistent high temps reduce long-term reliability.
Fan speed correlates with temperature. Macs with active cooling ramp up fans when temperatures rise. If fans run constantly at high RPM while your Mac idles, check Activity Monitor for runaway processes. Background tasks like indexing or backup can spike CPU usage temporarily—normal behavior that resolves on its own.
Laptops in clamshell mode (lid closed, external display attached) often run warmer because reduced airflow limits cooling. Elevating the MacBook or using a laptop stand improves ventilation. Desktop Macs benefit from unobstructed intake vents—avoid placing them against walls or inside closed cabinets.
Network Monitoring for Remote Work
Remote work increases network dependency. Video calls, file syncing, and cloud storage all compete for bandwidth. Network monitoring identifies which apps consume the most data, helping you prioritize traffic or troubleshoot connection issues.
Activity Monitor's Network tab lists data sent and received per app. Video conferencing apps like Zoom typically use 1.5 to 3 Mbps for HD video. Cloud storage services can spike to 50+ Mbps during initial syncs. Background processes like software updates also consume bandwidth—schedule large downloads for off-hours if your internet connection is limited.
iStat Menus adds historical network graphs that show bandwidth usage over time. This helps identify patterns, like daily spikes when Time Machine backups run or weekly surges when iCloud syncs large photo libraries. Adjust sync schedules or app settings to distribute network load more evenly.
VPN usage impacts network performance. Monitoring tools show the throughput reduction caused by encryption overhead. If video calls suffer on VPN, consider split tunneling—routing only work traffic through the VPN while video conferencing bypasses it. Check your IT department's policies before implementing this.
Managing Memory Pressure Over Time
Memory usage creeps up gradually. Apps that leak memory consume more RAM each time you use them, eventually forcing macOS to swap data to disk. This slows everything down, especially on Macs with 8GB RAM.
Activity Monitor's Memory tab shows real-time pressure, but iStat Menus adds historical graphs that reveal trends. If memory pressure spikes at the same time daily, a scheduled task is likely the culprit—perhaps a backup routine or automated workflow.
Closing unused apps frees memory, but some apps leave background processes running. Use Activity Monitor to identify lingering processes. Select the process and click the Stop button (X icon) to force quit it. Browser tabs are notorious memory consumers; close tabs you're not actively using or restart your browser periodically.
Upgrading RAM isn't possible on Apple Silicon Macs, so managing memory becomes more critical. macOS Tahoe includes improved memory compression that squeezes more performance from limited RAM, but monitoring helps you avoid pushing the system into swap file territory.
Disk Health and Storage Management
SSDs wear out as you write data to them. macOS doesn't expose raw SMART data in Activity Monitor, but third-party tools like iStat Menus display drive health percentages. Most SSDs last years under normal use, but heavy workflows accelerate wear.
Monitor write amplification if you frequently edit large files. Video editing, photo processing, and database work generate significant writes. Spreading these tasks across external drives reduces wear on your internal SSD. Keep the internal drive for the operating system and apps, and move project files externally.
Storage Sense in macOS Tahoe automatically removes temporary files and old downloads, but monitoring helps you spot apps that hoard space. Large app support files often accumulate unnoticed—Mail's local cache, Xcode's derived data, or browser caches. Use Activity Monitor's Disk tab to identify apps with high write activity, then investigate their storage footprint in System Settings > General > Storage.
Building a Performance Monitoring Routine
Effective monitoring isn't about watching graphs constantly—it's about building awareness of normal behavior. Check Activity Monitor weekly to establish baseline performance. Note typical CPU and memory usage when your standard apps are running. Deviations from this baseline signal problems.
Menu bar monitors provide passive awareness without demanding attention. Glance at metrics between tasks rather than focusing on them. Sharp spikes warrant investigation, but normal fluctuations are just your Mac adapting to workload.
Schedule deeper reviews monthly. Check drive health, review network usage patterns, and identify apps with creeping memory consumption. This proactive approach catches issues before they disrupt work—a small investment that prevents larger problems.
System monitoring transforms how you interact with your Mac. Instead of reacting to slowdowns, you anticipate and prevent them. The tools built into macOS Tahoe, combined with menu bar monitors, give you complete visibility into your Mac's operation—turning performance management from reactive troubleshooting into active optimization.